Christian Satzky
Financial Modeling
Data Science (MSc)
Financial Economics (MSc)
Project Summaries
QSheets I/O: Comparable Company Fundamentals with Nasdaq-100 Percentiles (Web App)
— 2023, QSheets.io.
![]()
QSheets I/O is a platform to generate PDF reports for US public equities, summarizing current and historical company fundamentals. As a benchmark, each company measure is accompanied by the point-in-time percentile rank with respect to Nasdaq-100 constituents.
Technologies
- R, RShiny
- HTML, CSS, JavaScript
Founder, Developer
Asian and European Option Specifics–Pricing, Estimation, and Comparison in R
— 2021, PDF version, GitHub repository.
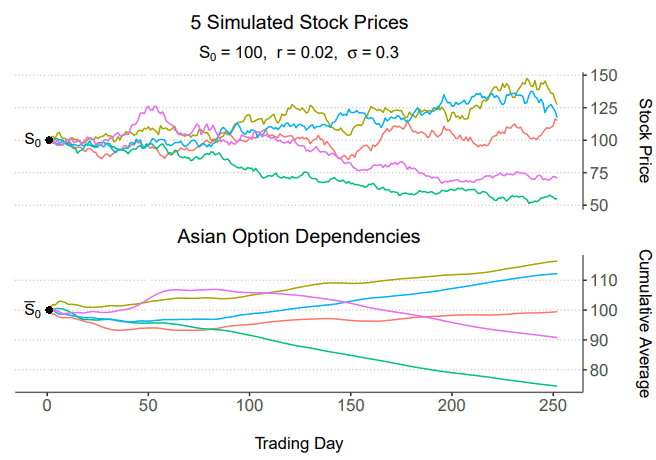
Conclusion (excerpt, p. 18):
“In this paper, I propose methods to estimate vanilla and exotic options’ prices and probability of exercise using Monte Carlo simulation in R. The computational efficiency of these methods relies on;
- Usage of vectorization, and
- Recycling of the simulated geometric Brownian motion paths.
In general, the cumulative average transformation (…) in the Asian option’s pay-off greatly reduces uncertainty as time goes by. This leads to lower variability in the option’s price, delta, and probability of exercise. (…) [The] Asian option’s delta (…) inevitably approaches zero over time, as the underlying’s future prices have continuously less impact on the option’s pay-off.”
Model Implied Asset Pricing Beliefs: An Empirical Analysis for S&P 500 Constituents from 2010–2020
— 2021, PDF version, GitHub repository.
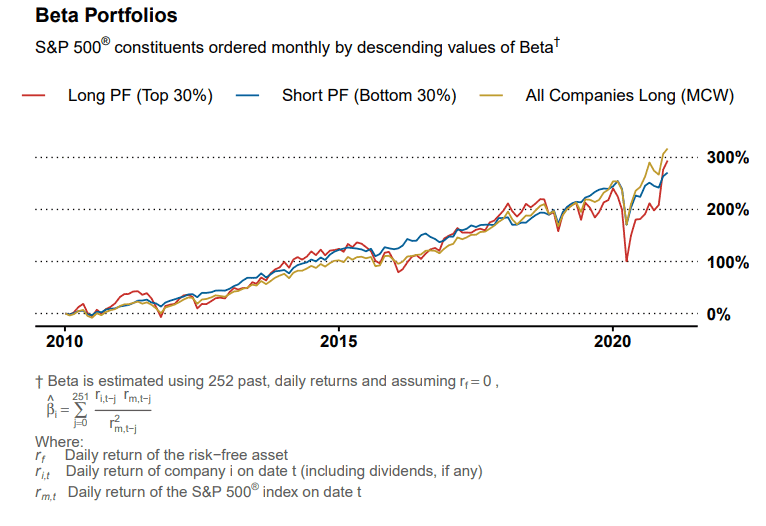
Abstract (excerpt, p. 3):
“In this study, I am deriving explicit and implicit investment hypotheses from the Capital Asset Pricing Model (Sharpe, 1964), the Fama and French 5 Factor Model (Fama and French, 1993), and common price multiples. I empirically investigate the credibility of these investment beliefs using data from S&P 500 constituents from January 2010 to December 2020. The significance of each investment hypothesis is assessed by two methods of statistical evaluation.”
Conclusion (excerpt, p. 32):
“(…) This research found credible statistical evidence in support of the “high GrowthSpread® outperforms low GrowthSpread®”-hypothesis. There is no statistical evidence in favor of any of the remaining eight hypotheses under investigation. When it comes to one-directional portfolios, I found evidence in support of the following statements:
- The high GrowthSpread® portfolio significantly outperforms portfolios drawn at random;
- The low GrowthSpread® portfolio significantly underperforms portfolios drawn at random;
- The low Price-to-Cash Flow portfolio significantly underperforms portfolios drawn at random.
Noteworthy, there is some, but insignificant evidence in support of the low Profitability, high Profitability, small Size, and low Beta portfolios.”
Silver Commodity Market-Timing—A Simple Macroeconomic Pricing Model
— 2021, PDF version, GitHub repository.

In this article, I develop a macroeconomic ‘fair-value’ indicator for the silver spot price.
Conclusion (excerpt, p. 11):
“(…) empirical analysis suggests that the silver spot price is roughly twice as sensitive to changes in USD expected inflation than it is to changes in the 10-year U.S. Treasury rate. When it comes to market-timing, it can be concluded the following:
A Strong Bullish XAG/USD Case:
- A silver indicator value I ≥ 10,
- A rise in inflation beyond the expected change in future inflation,
- A future decrease in the long-term risk-free rate,
- An increase in demand for silver as a resource for production,
- A decrease in trust in cryptocurrency.
A Strong Bearish XAG/USD Case:
- A silver indicator value I ≤ -10,
- A decrease in inflation beyond the expected change in future inflation,
- A future increase in the long-term risk-free rate,
- A decrease in demand for silver as a resource for production,
- A continued increase in trust and acceptance in cryptocurrency.”
Forecasting EUR/USD Volatility Using Supervised Learning
— 2020, PDF version, GitHub repository.
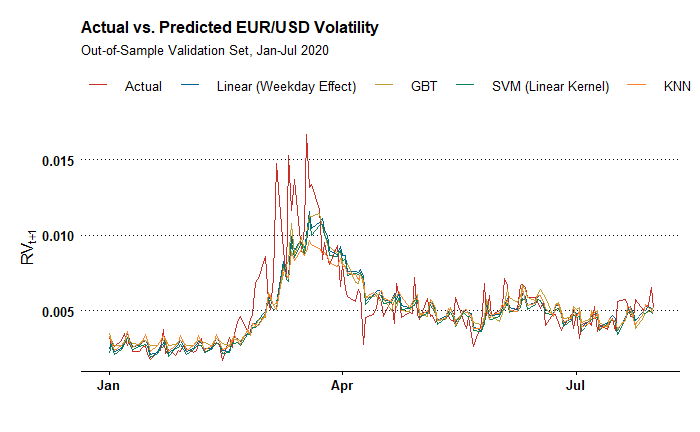
Conclusion (excerpt, pp. 19-20):
“When it comes to predicting financial volatility,
- During ‘normal’ times, the support vector machine algorithm with linear kernel outperforms all other considered methods. This is confirmed by two out-of-sample datasets (…);
- During periods of market turmoil, the gradient boosted tree algorithm outperforms all other considered methods. This is confirmed by the complete validation set which is heavily impacted by turbulence surrounding the Covid-19 pandemic.
The self-developed linear weekday effect model improves over the HAR-RV model by Corsi (2009). It performs second best during ‘normal’ and ‘crisis’ times, respectively. The absence of any tuning parameters and the apparent robustness across market conditions makes this model a well-suited candidate for applications in practice.
Noteworthy, in the appendix, it is found that the industry-prevalent GARCH(1,1) model is outperformed by all models considered.”
Contact: C.Satzky@gmail.com.